DIGNITY explores factors which impact on the use of digital travel solutions
As part of the DIGNITY project, the team at the University of Cambridge coordinated surveys examining levels of digital mobility exclusion across five European countries and regions [Germany, Italy, Netherlands, Barcelona Metropolitan Area (Spain) and Flanders (Belgium)]. The surveys examined a range of factors that affect exclusion, including technology access, previous technology experience, attitudes towards technology and basic digital interface competence.
Assessing basic digital skills and competences
In particular, basic technology competence was measured using paper mockups of smartphone interfaces, like the one shown below. Participants were asked what they would do on a range of simple smartphone tasks. For example, with the image below, they were asked to change the number of adults in the search for accommodation, make a keyboard appear so they could type in the location and set the website to be one of their bookmarks or favourites. Other tasks covered search, changing settings, creating a new item, opening a menu with more options and going back to a previous screen (using a back arrow).
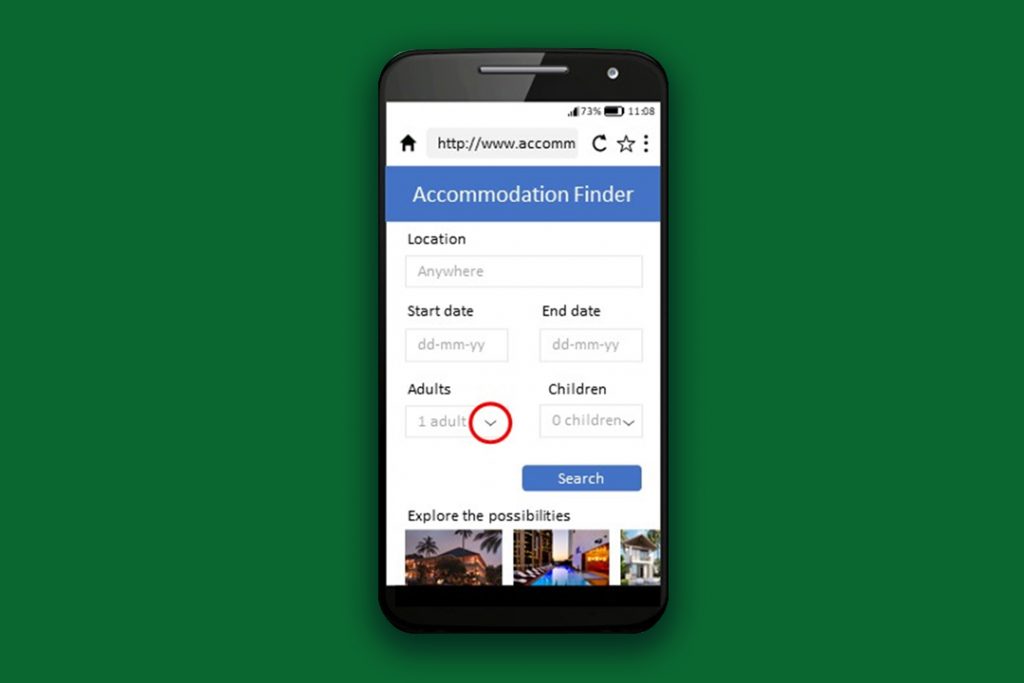
Participants were asked what they would do to change the number of adults in this search for accommodation. The correct answer is to tap on the down arrow highlighted with a red circle in this image.
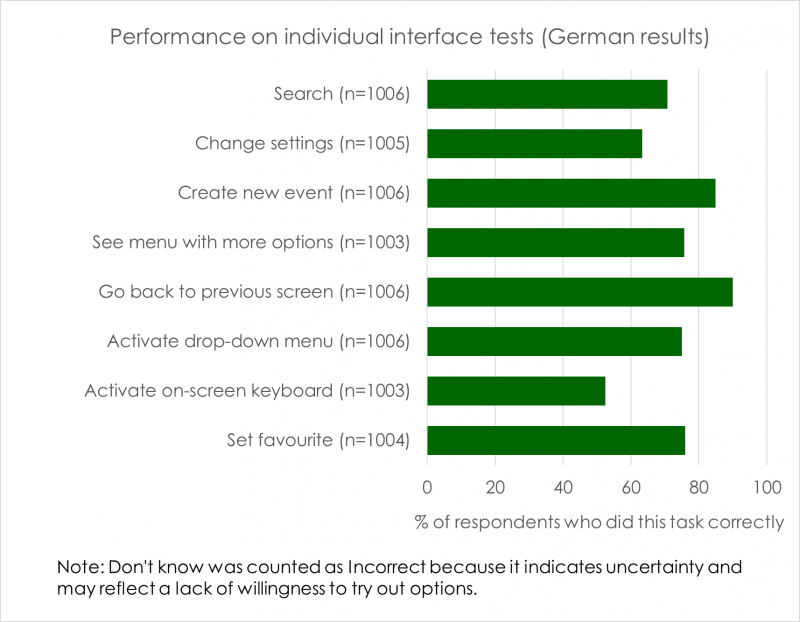
Due to the basic nature of the tasks, participants were considered to have a low level of basic digital interface competence if they got four or fewer tasks correct out of a total of eight.
The surveys found that between 18% (in Flanders) and 33% (in Italy) had a low level of basic digital interface competence and are likely to struggle on many modern interfaces, particularly on smartphones and tablets.
Quantifying the use of digital mobility services
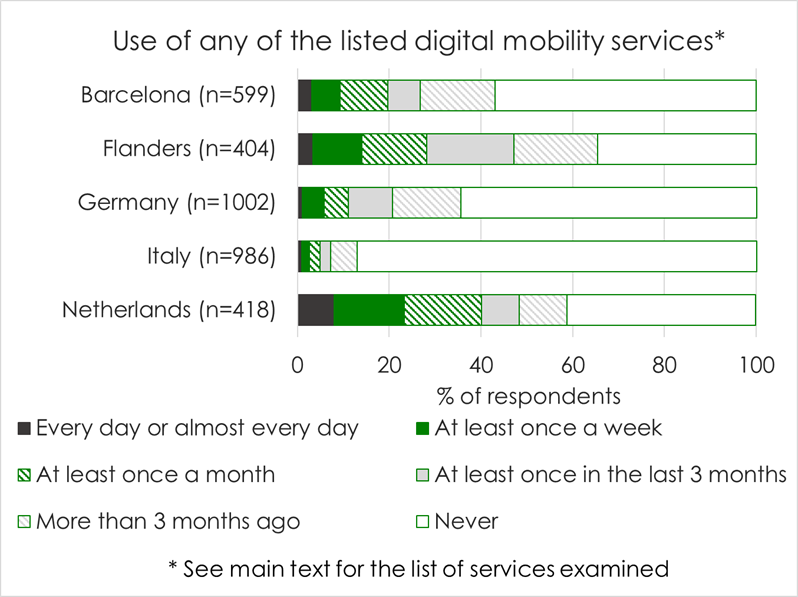
The surveys also examined the use of digital mobility services including car sharing, car pooling, on-street bike hire, on-street scooter and motorbike hire, and using a mobile phone to pay at a parking meter. The use of these services was low – between 35% in Flanders and 87% in Italy had never used any of them. The variation in use between countries may reflect differences in the roll-out of services in different areas as well as differences in uptake. These findings indicate that there is a long way to go before these services truly become mainstream, especially in Italy.
Inclusive and user-friendly design matters!
The combination of findings related to basic digital skills and those concerning the actual use of digital mobility services indicates the importance of inclusive design in developing digital mobility services, ensuring that interfaces are easy to use and do not require prior knowledge and experience, and providing non-digital alternatives for those who need them.
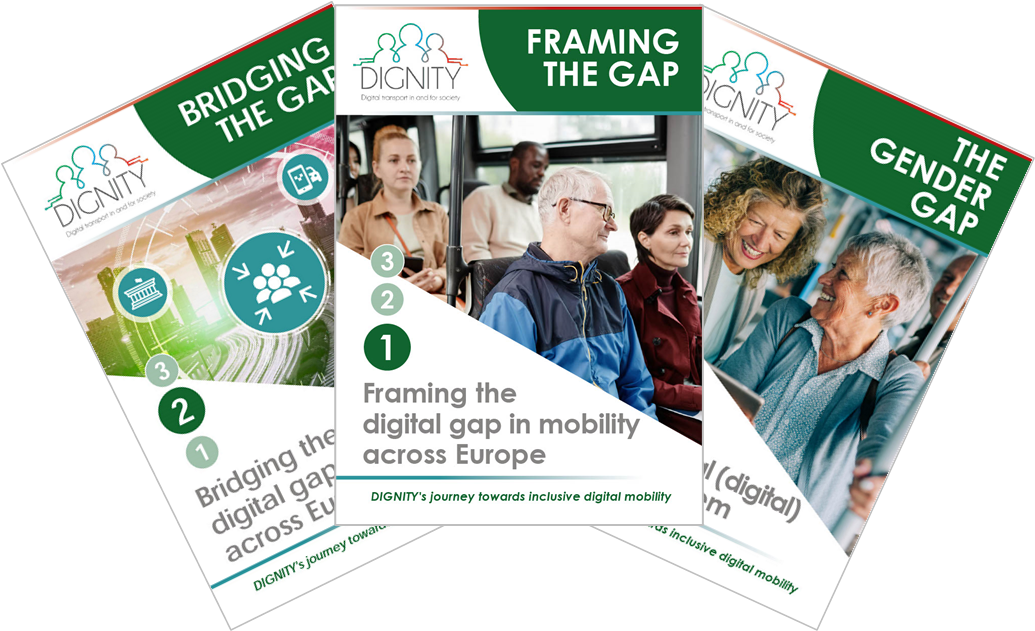
A pdf with fuller results from the surveys is available from the DIGNITY project website. The datasets themselves will be made available open access later this year on the UPCommons repository.